7. Software with GUI
OpenCorr GUI is developed using the frame of Dear ImGui. It aims to facilitate the users to process their experimental data. You can download the package from Releases on GitHub or the Download page on opencorr.org. Unzip it (e.g. using 7-Zip) and run OpenCorr.exe, make sure that the other DLL files are in the same folder. Some examples can be found in folder gui_soft in the repository of GitHub or opencorr.org. This software is developed by a small team (Mr LI Rui, Mr REN Haoqiang and Dr JIANG Zhenyu). Its function and usage experience are far from perfect at the moment. Any comments and suggestions are greatly appreciated.
OpenCorr GUI is released as shareware, which is free for non-commercial purpose. You can download OpenCorr GUI 2.0 (with limited functions) to have a try. If you would like to use the full function version, please contact us through email (using the mailbox of your institution) and let us know your name, institution, and research project. If you are a graduate student, please provide the information of your supervisor. We will send you the software and keep the information confidential.
Figure 7.1 shows the interface to run 2D DIC. One reference image and a bunch of target images can be loaded and displayed in the righthand side window. We can press the CTRL or SHIFT key to select multiple files in file dialog.
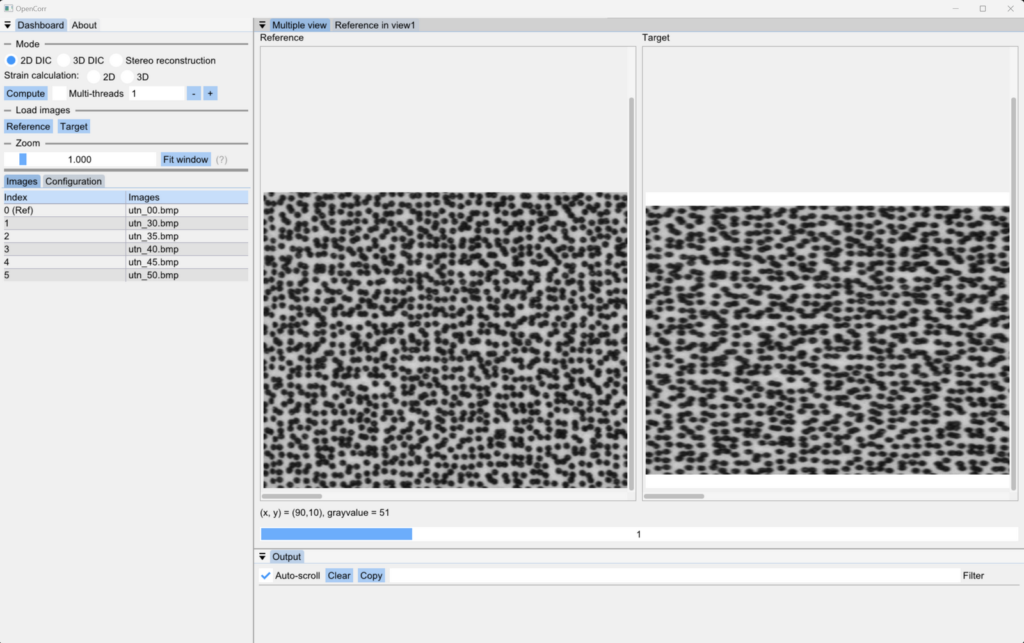
Figure 7.1. Interface of 2D DIC in multiple view
We can also shift to single view for convenience to set DIC parameters, as shown in Figure 7.2. A yellow rectangle appears in the center of window once the box of “Show subset” is checked. Then, we can change its size to see if there is a unique speckle pattern within it.
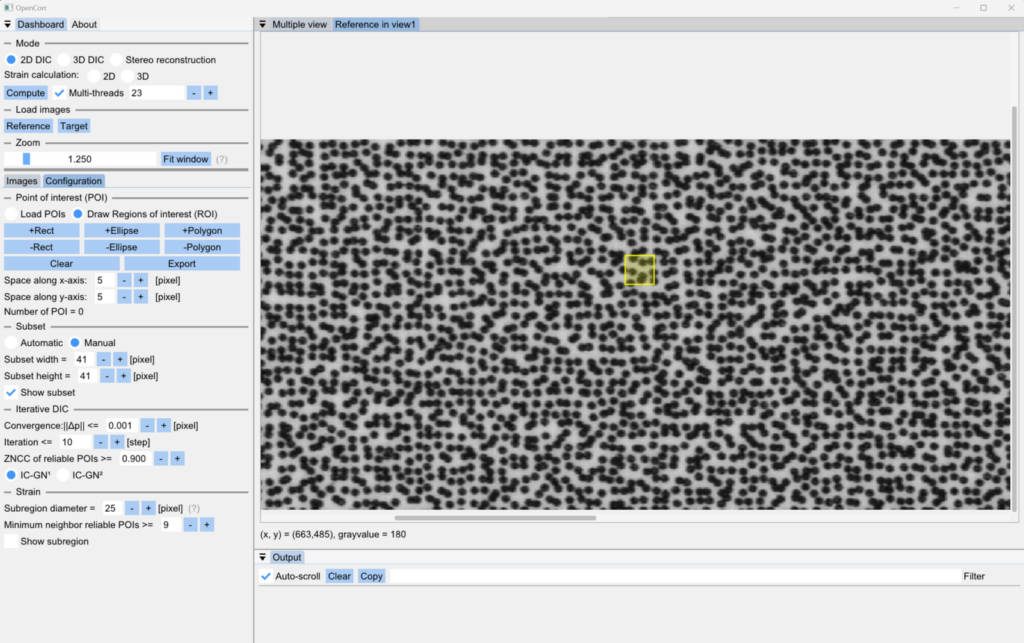
Figure 7.2. Interface of 2D DIC in single view
Figure 7.3 shows the interface to run 3D/stereo DIC. The images in left column are regarded as primary view, and the ones in right column are secondary view.
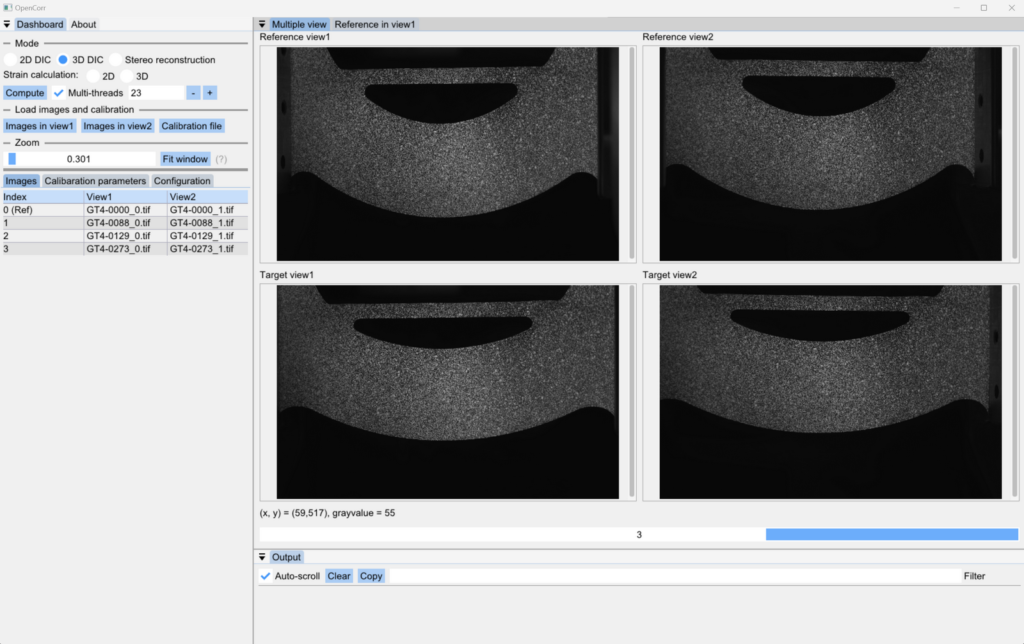
Figure 7.3. Interface of 3D/stereo DIC in multiple view
To run 3D/stereo DIC, we need to load the calibration parameters of cameras from a CSV file (Figure7.4). An example of datasheet is given in the package (*_Calibration.csv in package).
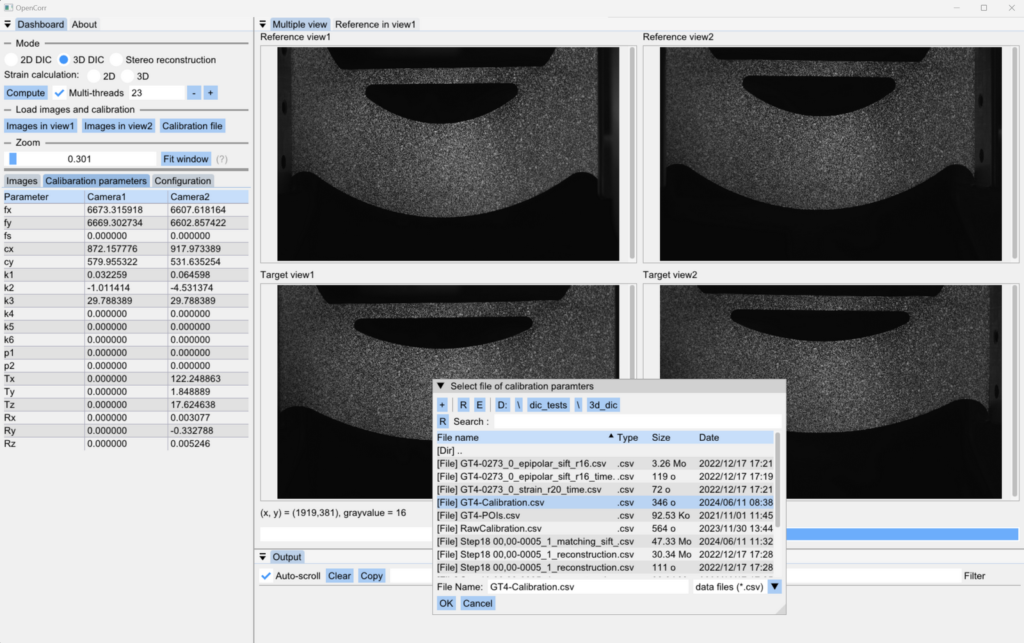
Figure 7.4. Load calibration parameters of cameras for 3D/stereo DIC
We can draw the region of interest (ROI) and set the space between the POIs to create a matrix of uniformly distributed POIs, as shown in Figure 7.5. Yellow areas represent the ROI, and blue areas are excluded from ROI. The coordinates of POIs can be exported to a CSV file if we would like to use them in future.
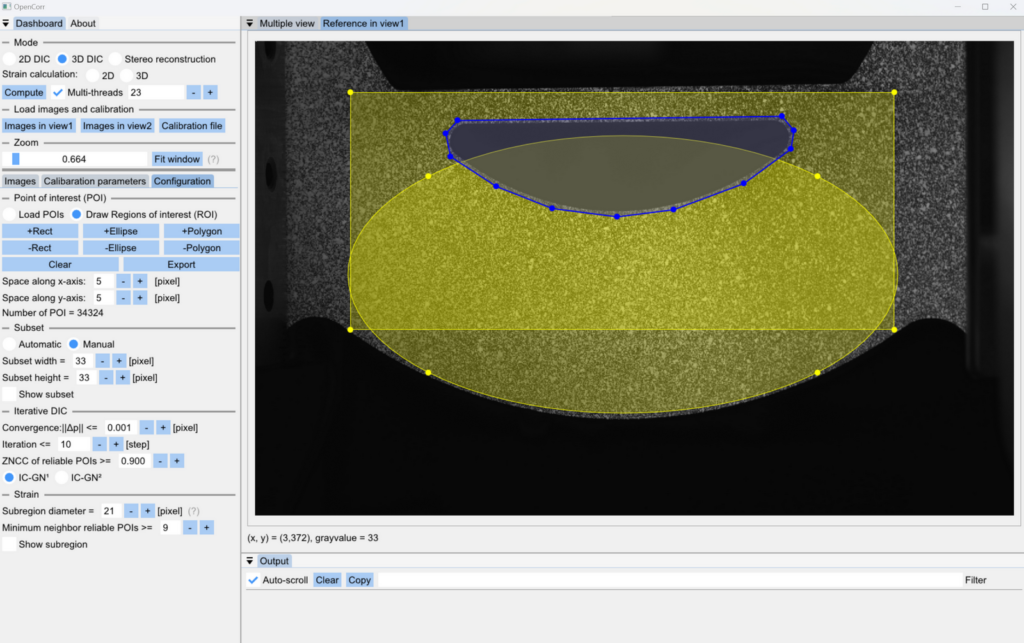
Figure 7.5. Draw region of interest (ROI) in single view (yellow area means the ROI, blue area means the excluded part)
Figure 7.6 shows the interface in for stereo reconstruction to measure the 3D shape of an object. In addition to drawing ROI and setting POI space, the POIs can be loaded from a previously saved CSV file.
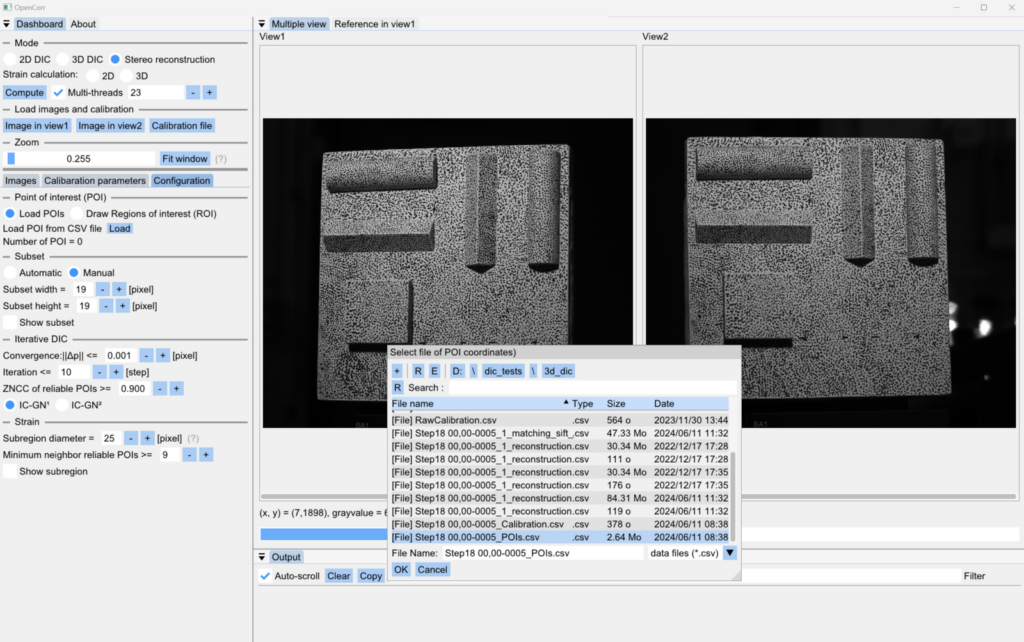
Figure 7.6. Interface of stereo reconstruction (multiple view). POIs can be loaded from a CSV file
Figure 7.7 shows the interface to run DVC. The software supports multi-page TIFF image and binary file (.bin) defined in OpenCorr. We can check the sections by dragging the sliders above views (the green lines indicate the position of sections). The lower-right figure illustrates the 3D coordinate system and the directions of sights.
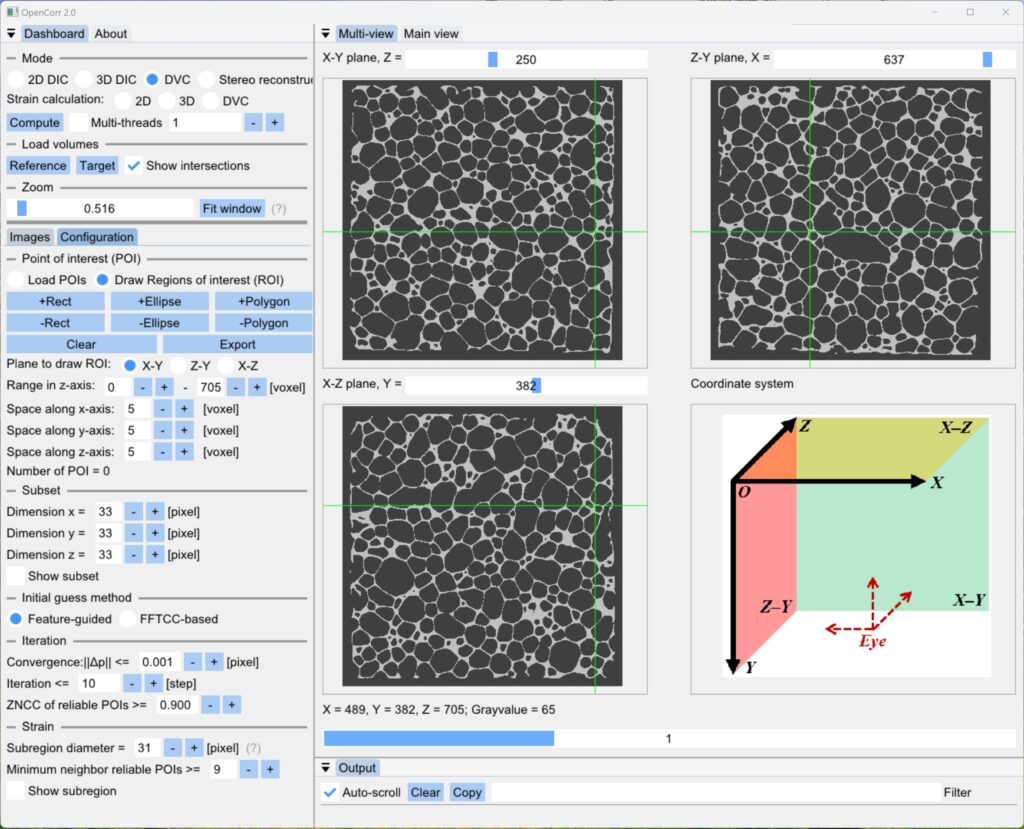
Figure 7.7. Interface of DVC in multiple view
We can choose a proper section to draw ROI, and adjust its range in the axis perpendicular to the section (in dashboard), as shown in Figure 7.8.
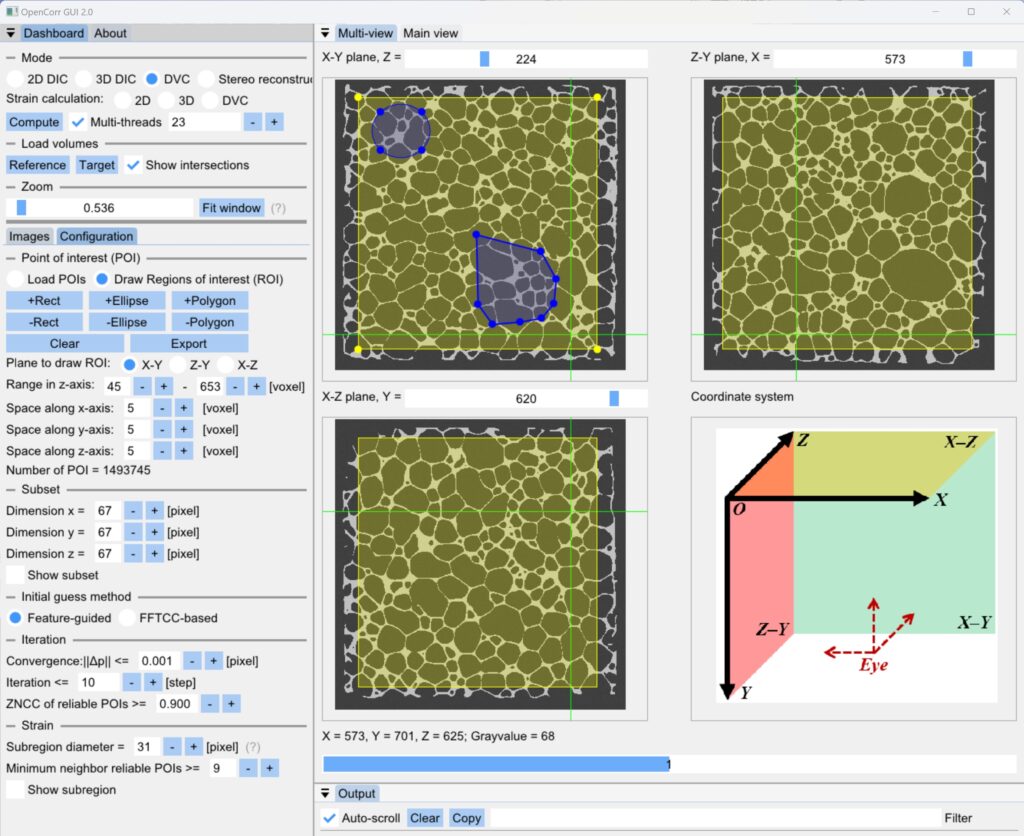
Figure 7.8. Draw ROI on the selected section in multiple view
Similar to DIC mode, we can use main view to observe the section with higher resolution (Figure 7.9), as well as check if the sizes of subset or subregion are proper.
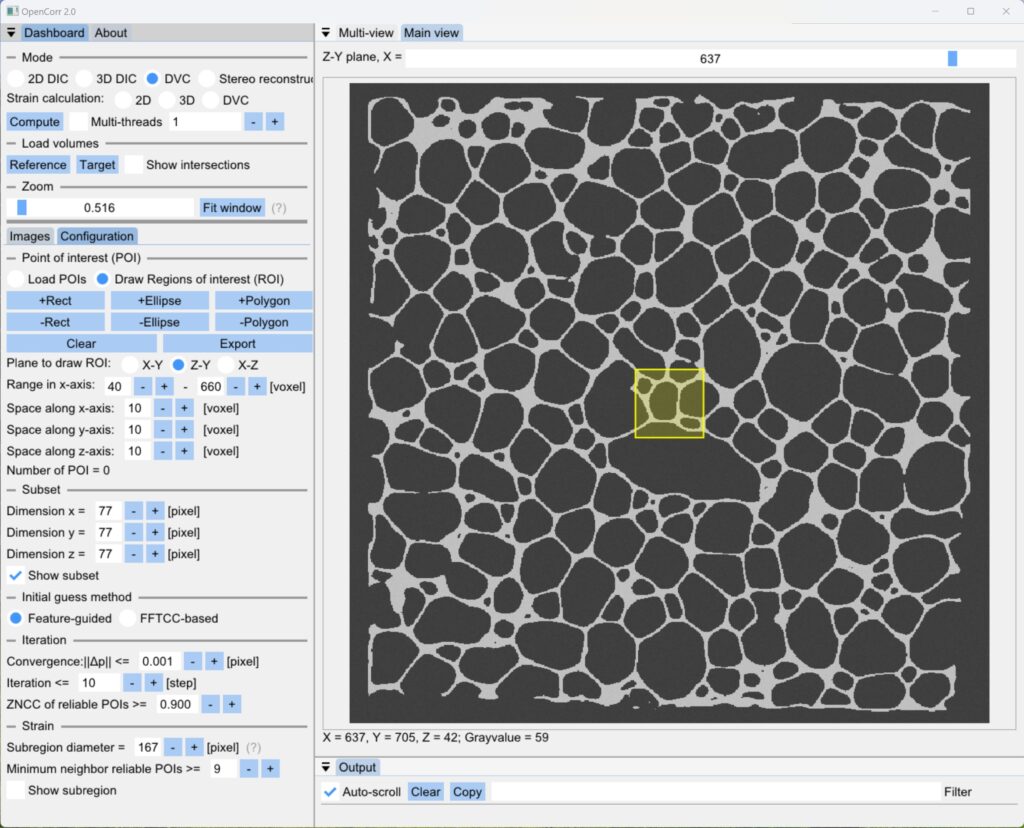
Figure 7.9. Check section, as well as subset or subregion in main view
Figure 7.10 shows the interface for strain calculation. We can recalculate the strains based on the previously obtained DIC results. Parameters like subregion size and ZNCC threshold can be adjusted to get reliable results, according to the yellow circle and points within it (they will be displayed when the box “Show subregion” is checked).
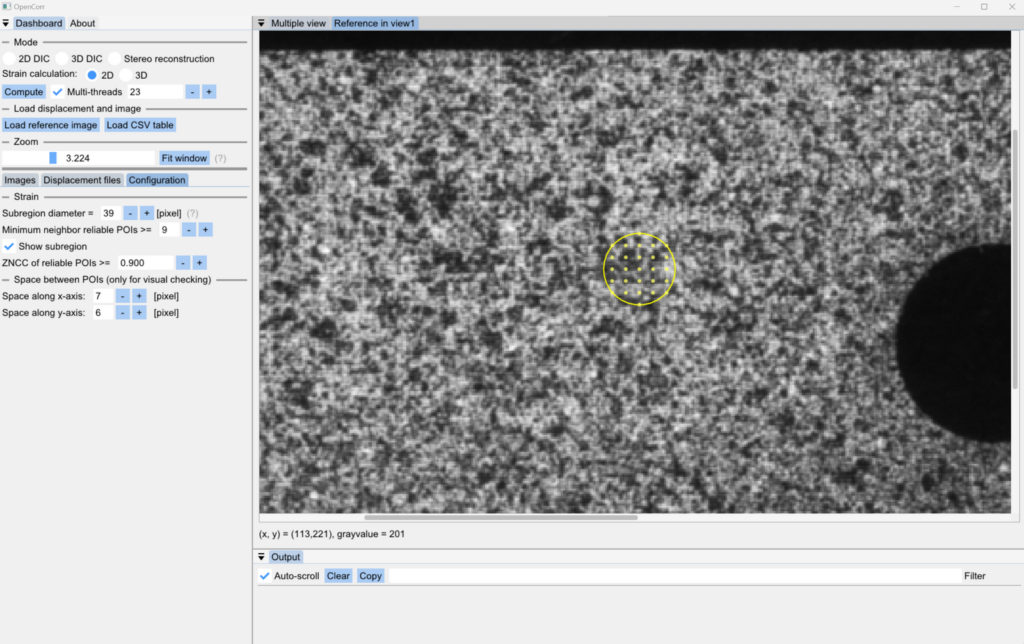
Figure 7.10. Interface of strain calculation. DIC results need to be loaded from CSV files